AFRICASTTidy time series & forecasting in R
Session 10 of 10
Which time series foundation models have you heard of?
We want forecasts for the next four quarters of Snowy Mountains holiday travel.
What changes in this session?
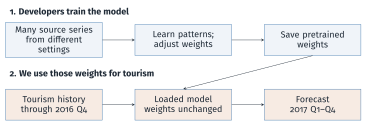
We start with a model that has already learned from many time series.
We use the same fitting method, but learn from each region’s history separately.
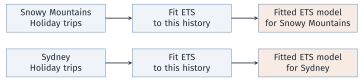
What changes with a foundation model?
We can reuse a model already trained on many series, then supply our tourism history to obtain a forecast.
Train broadly, then reuse
A foundation model is trained on large, varied data so that it can be reused for a range of tasks and settings.
1. Large, varied training data
Learn from many examples and settings.
3. Reusable across tasks
Apply the trained model to different series.
2. Often many parameters
Learned numbers store the model’s behaviour.
4. Can be adapted
Further training can tailor it to our data.
These features make reuse possible. They do not guarantee the best forecast for every series.
1. Models built for time series
Learn from collections of time series, then forecast a new series.
TimeGPT, Chronos-2, TimesFM and Moirai follow this route.
2. Language models adapted for forecasting
Start with a pretrained language model and adapt how time-series inputs and forecasts are represented.
Examples: PromptCast and Time-LLM. Our code uses the first route.
| Advantages | Disadvantages |
|---|---|
| Use out-of-the-box forecasting pipelines | Privacy concerns |
| Can generate forecasts with few data points | No control of model’s capabilities |
| Require less forecasting expertise | May not be optimal for every use case |
| Reusable across tasks | High resource requirements |
For our tourism example
Getting a forecast is easier. We still need to check whether it is useful.
Using a model learned from other series is transfer learning.
| Challenge | What the model developer must handle |
|---|---|
| Different frequencies and domains | Quarterly tourism and hourly energy demand have different patterns. |
| Different forecast horizons | One week means 7 daily values or 168 hourly values. |
| Training resources | Large-scale training takes time, memory and often GPUs. |
| Enough varied training data | Open time-series data can be scarce; combining sources takes work. |
Why start with pretrained weights?
We can reuse that training effort, then test the model on our own task.
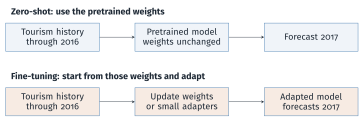
Both use tourism history. Neither is allowed to learn from the 2017 test observations.
| Model | Architecture | Input representation | Forecast output |
|---|---|---|---|
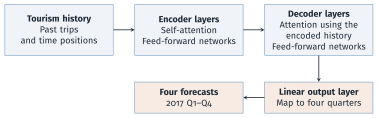
| TimeGPT-1 | Encoder–decoder | History and positions | Point and intervals (API) |
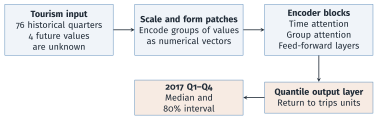
| Chronos-2 | Encoder-only | Patches; optional predictors | Quantiles |
| TimesFM 2.5 | Decoder-only | Historical patches | Point and quantiles |
| Moirai 1.0 | Encoder-only | Patches; optional predictors | Distribution |
| Lag-Llama | Decoder-only | Lags and time features | Distribution |
| Tiny Time Mixers | MLP mixer | Patches; predictors when adapted | Point forecasts |
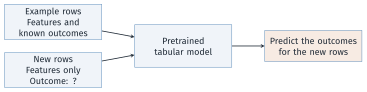
Examples: TabPFN and TabICL.
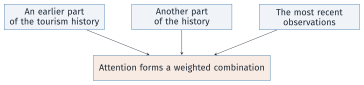
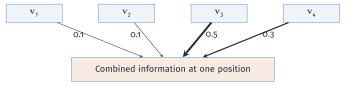
Attention combines information across positions. A feed-forward network refines the information at each position.
Time attention: share information across the history.
Group attention: share information across related series or predictors, when supplied.
After the break
Forecast quarterly tourism, examine outputs, and compare zero-shot forecasts with fine-tuned forecasts.
The steps we will follow
Prepare the history → forecast → evaluate → adapt → compare.
Select the same series in R. We will pass it to the models through their Python interfaces:
The Python interface uses three columns:
| Workshop column | Model column | Meaning |
|---|---|---|
| Region and Purpose | unique_id |
Series identifier |
| Quarter | ds |
Quarter-start date |
| Trips | y |
Trips, thousands |
The model needs an identifier, a date and the number of trips.
import pandas as pd
import numpy as np
tourism = pd.read_csv("data/tourism.csv", parse_dates=["Quarter"])
keep = ((tourism.Region == "Snowy Mountains") &
(tourism.Purpose == "Holiday"))
df = tourism.loc[keep].rename(columns={"Quarter": "ds", "Trips": "y"})
df["unique_id"] = "Snowy Mountains / Holiday"
df = df[["unique_id", "ds", "y"]].sort_values("ds")
H = 4
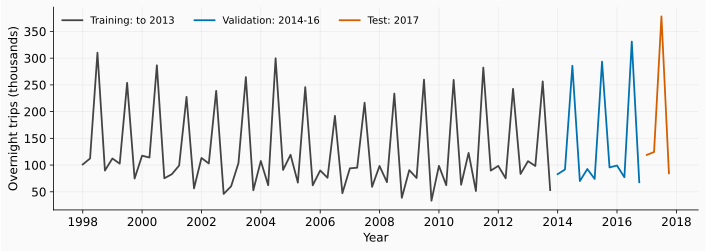
history, test = df.iloc[:-H], df.iloc[-H:]Result: 76 historical observations and 4 test observations.
Validation uses three four-quarter forecasts covering 2014–2016. The 2017 observations are reserved for the final comparison.
For each quarter of 2017, repeat the corresponding observation from 2016.
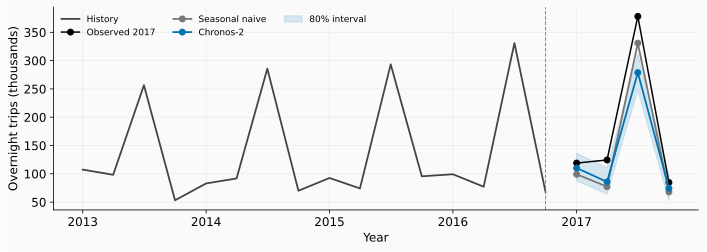
[99.21, 77.21, 330.99, 67.95]
These are forecasts for Q1–Q4, in thousands of trips. Every model will be compared with this benchmark on the same dates.
h=4: four quarters; QS: quarter-start dates; level=[80]: an 80% interval.
Load the model and request a median forecast with an 80% interval.
| ds | 0.1 | 0.5 | 0.9 |
|---|---|---|---|
| 2017-01-01 | 87.67 | 110.23 | 136.42 |
| 2017-04-01 | 64.07 | 85.74 | 110.65 |
| 2017-07-01 | 247.12 | 278.78 | 311.71 |
| 2017-10-01 | 52.49 | 74.47 | 97.20 |
0.5 is the median forecast. 0.1 and 0.9 are the lower and upper interval limits. Values are thousands of trips.
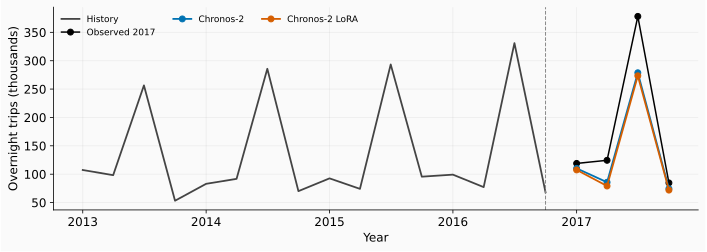
The model misses the winter peak. Its 80% interval contains 2 of the 4 observed quarters; four quarters are too few to assess long-run coverage.
Let \(e\) be the observed number of trips minus the forecast.
| Measure | Calculation | How to read it |
|---|---|---|
| MAE | \(\operatorname{mean}(\lvert e\rvert)\) | Average absolute miss |
| RMSE | \(\sqrt{\operatorname{mean}(e^2)}\) | Gives large misses more weight |
Match each forecast with the observation for that quarter.
MAE: 39.27; RMSE: 53.75
Before changing the model, check its performance on earlier forecast periods as well.
Forecast one year at a time, using only the history available then.
| History ends | Forecast year |
|---|---|
| 2013 Q4 | 2014 |
| 2014 Q4 | 2015 |
| 2015 Q4 | 2016 |
| Model | Validation MAE | Validation RMSE |
|---|---|---|
| Seasonal naive | 17.68 | 20.65 |
| Chronos-2 | 18.45 | 23.13 |
These scores cover 12 validation quarters. Keep 2017 for the final test.
Use the same history and horizon, with ten training updates.
finetune_steps counts training updates; h counts future quarters.finetune_loss="mae" uses absolute errors during adaptation.LoRA trains a small set of added weights while keeping the original weights fixed.
lora_settings contains the fixed training settings listed in the notebook.
What changes?
We get an adapted model. The history and the four forecast dates stay the same.
The adapted model still misses the winter peak. Did its overall error improve?
| Model | MAE | RMSE |
|---|---|---|
| Seasonal naive | 32.73 | 35.80 |
| Chronos-2 | 39.27 | 53.75 |
| Chronos-2 LoRA | 43.55 | 57.68 |
Both measures: thousands of trips. Chronos-2 rows use median forecasts.
Seasonal naive has the smallest error under both measures. Ten-step LoRA made both scores worse; this one year cannot establish a general ranking.
Suppose we are forecasting in December 2016.
| Information for 2017 | Available now? |
|---|---|
| Calendar quarter | Yes |
| Actual weather | No |
| Actual number of trips | No: our forecast target |
Supply historical predictor values and any future values known at forecast time.
The lab uses calendar features through future_df. Check their value on earlier forecasts.
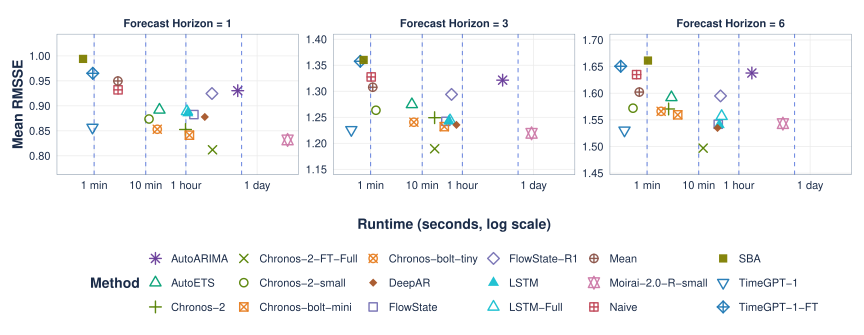
Why use RMSSE here?
RMSSE is RMSE divided by a scale based on historical seasonal changes. It lets us compare errors across series with different volumes. Smaller is better.
Lower and further left is preferable. Chronos-2 fine-tuning improves accuracy here, but adds computation.
Independent lab
exercises/day5-foundation_models/tourism_lab.ipynb
One row per quarter; predict trips from the feature columns.
| Quarter | Time index | Quarter of year | Trips (thousands) |
|---|---|---|---|
| 2016 Q1 | 73 | 1 | 99.21 |
| 2016 Q2 | 74 | 2 | 77.21 |
| 2016 Q3 | 75 | 3 | 330.99 |
| 2016 Q4 | 76 | 4 | 67.95 |
| 2017 Q1 | 77 | 1 | ? |
| 2017 Q2 | 78 | 2 | ? |
| 2017 Q3 | 79 | 3 | ? |
| 2017 Q4 | 80 | 4 | ? |
Use historical rows as context. Supply future features; keep future trips unknown.
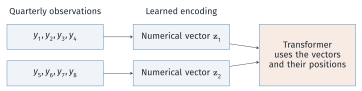
Attention combines information from past patches.
Use a past window to predict the observations immediately after it.
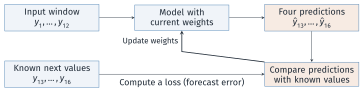
Repeat across windows and series. The training targets are already in the historical data.